Portfolio Intelligence

The Location Vitality Index

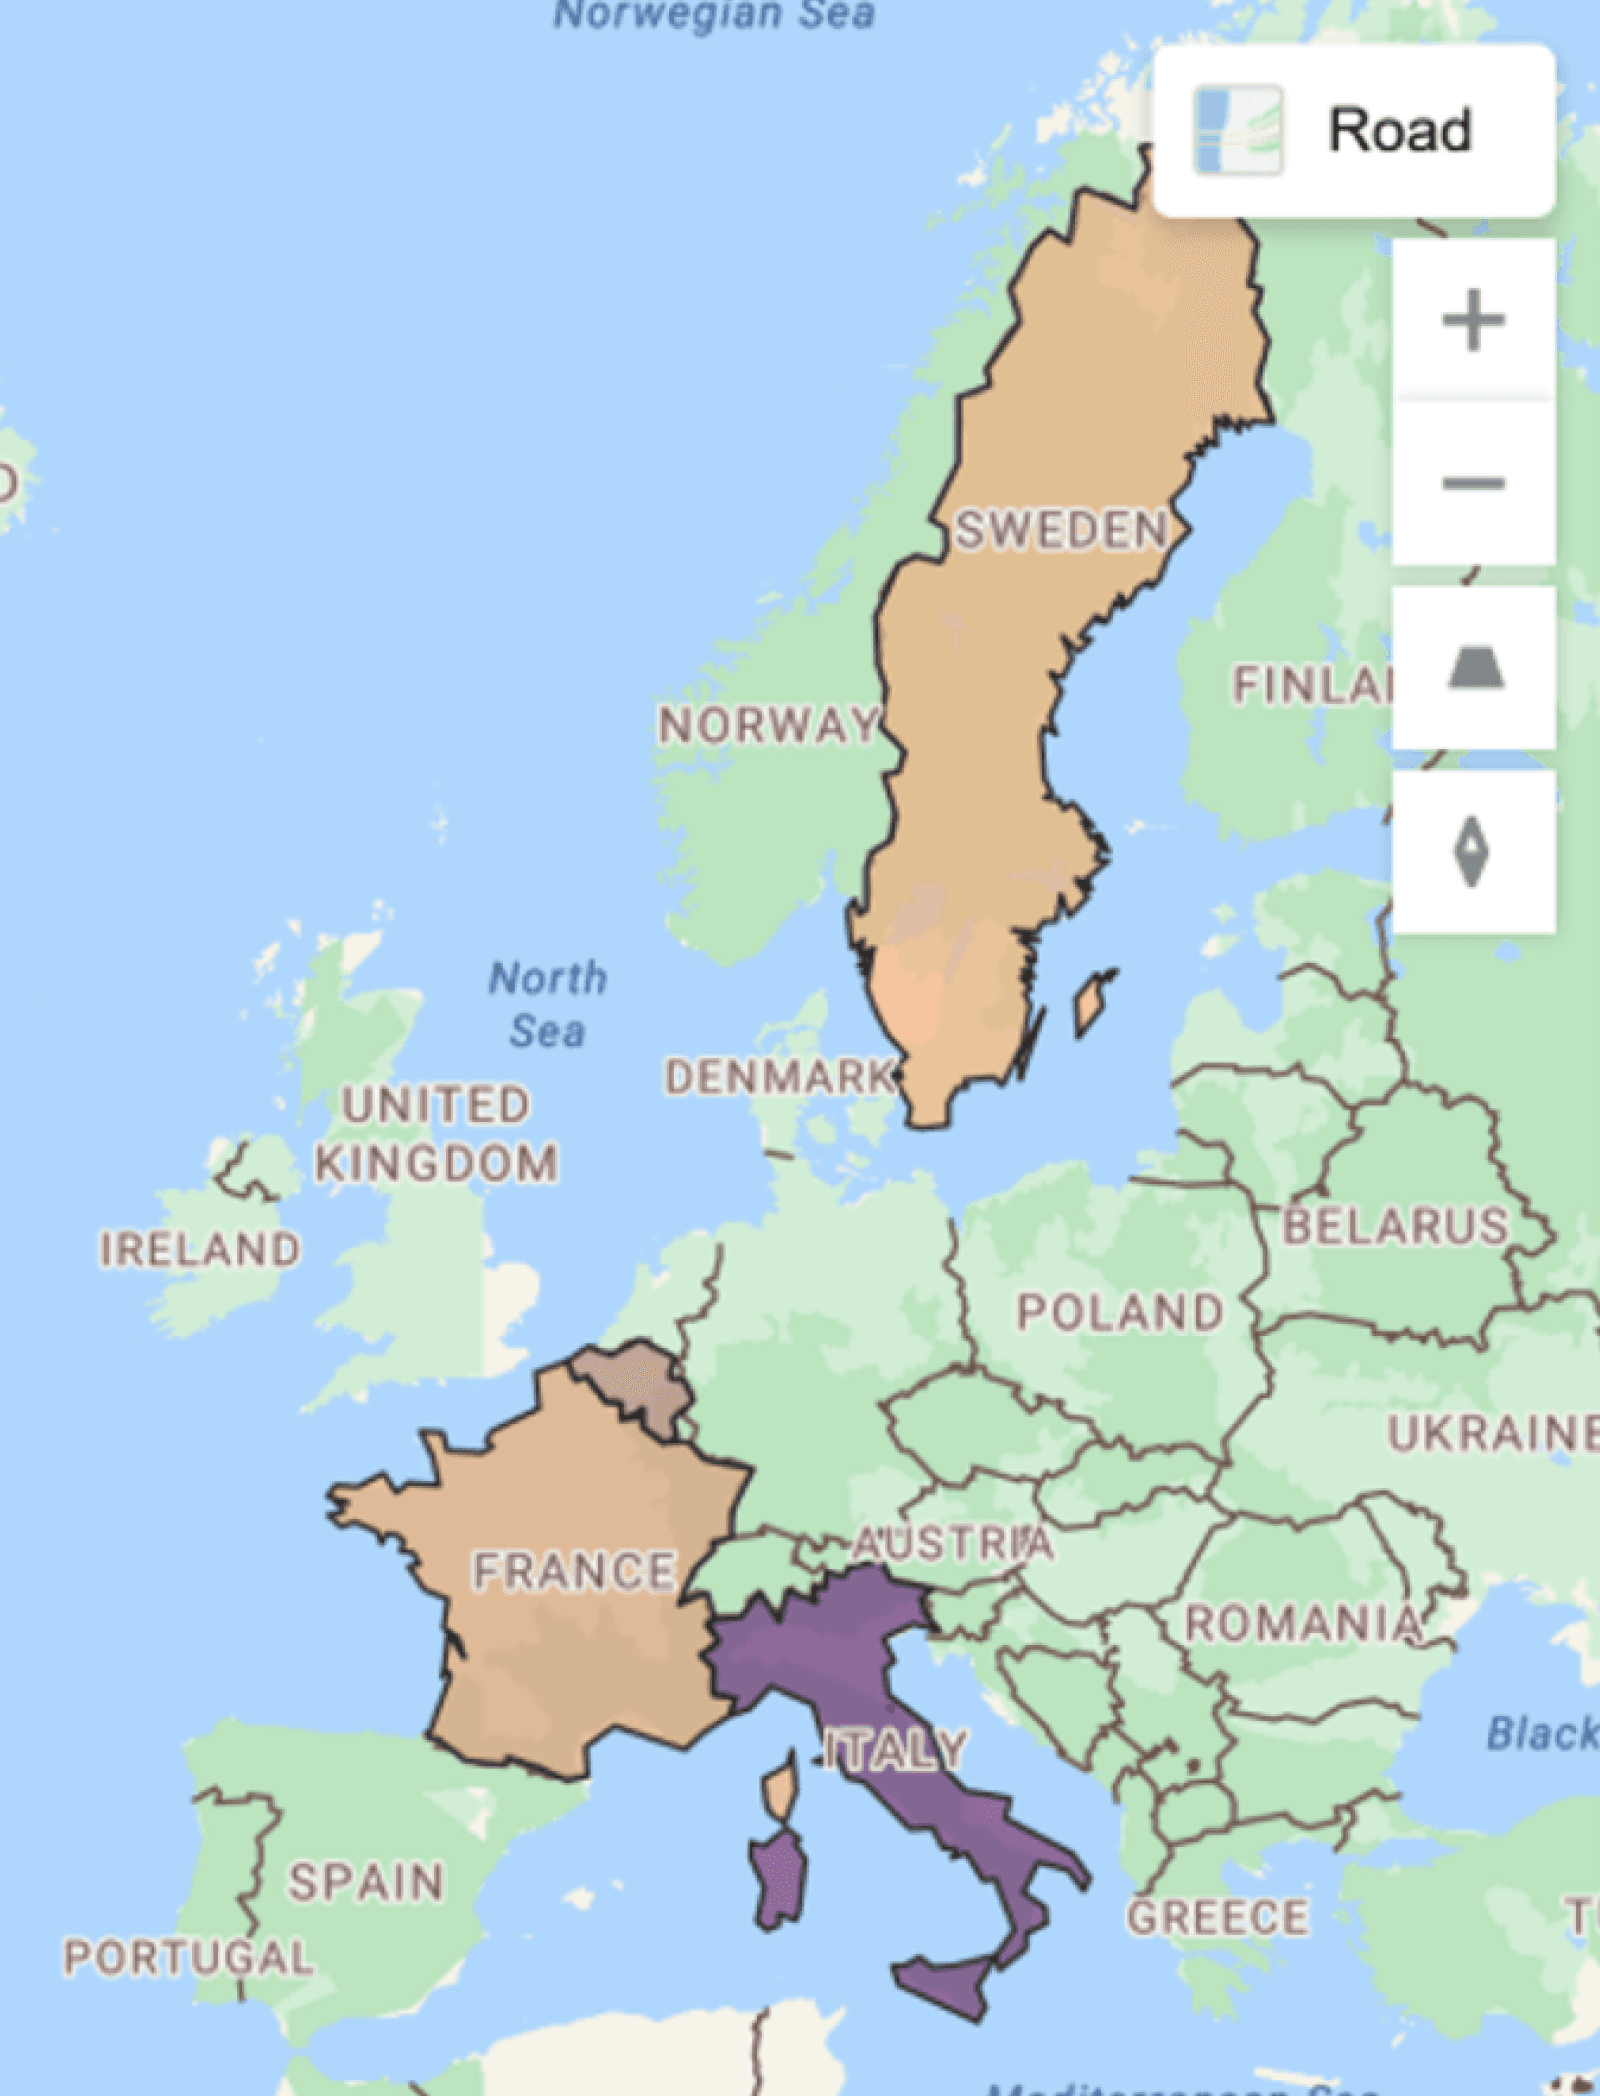
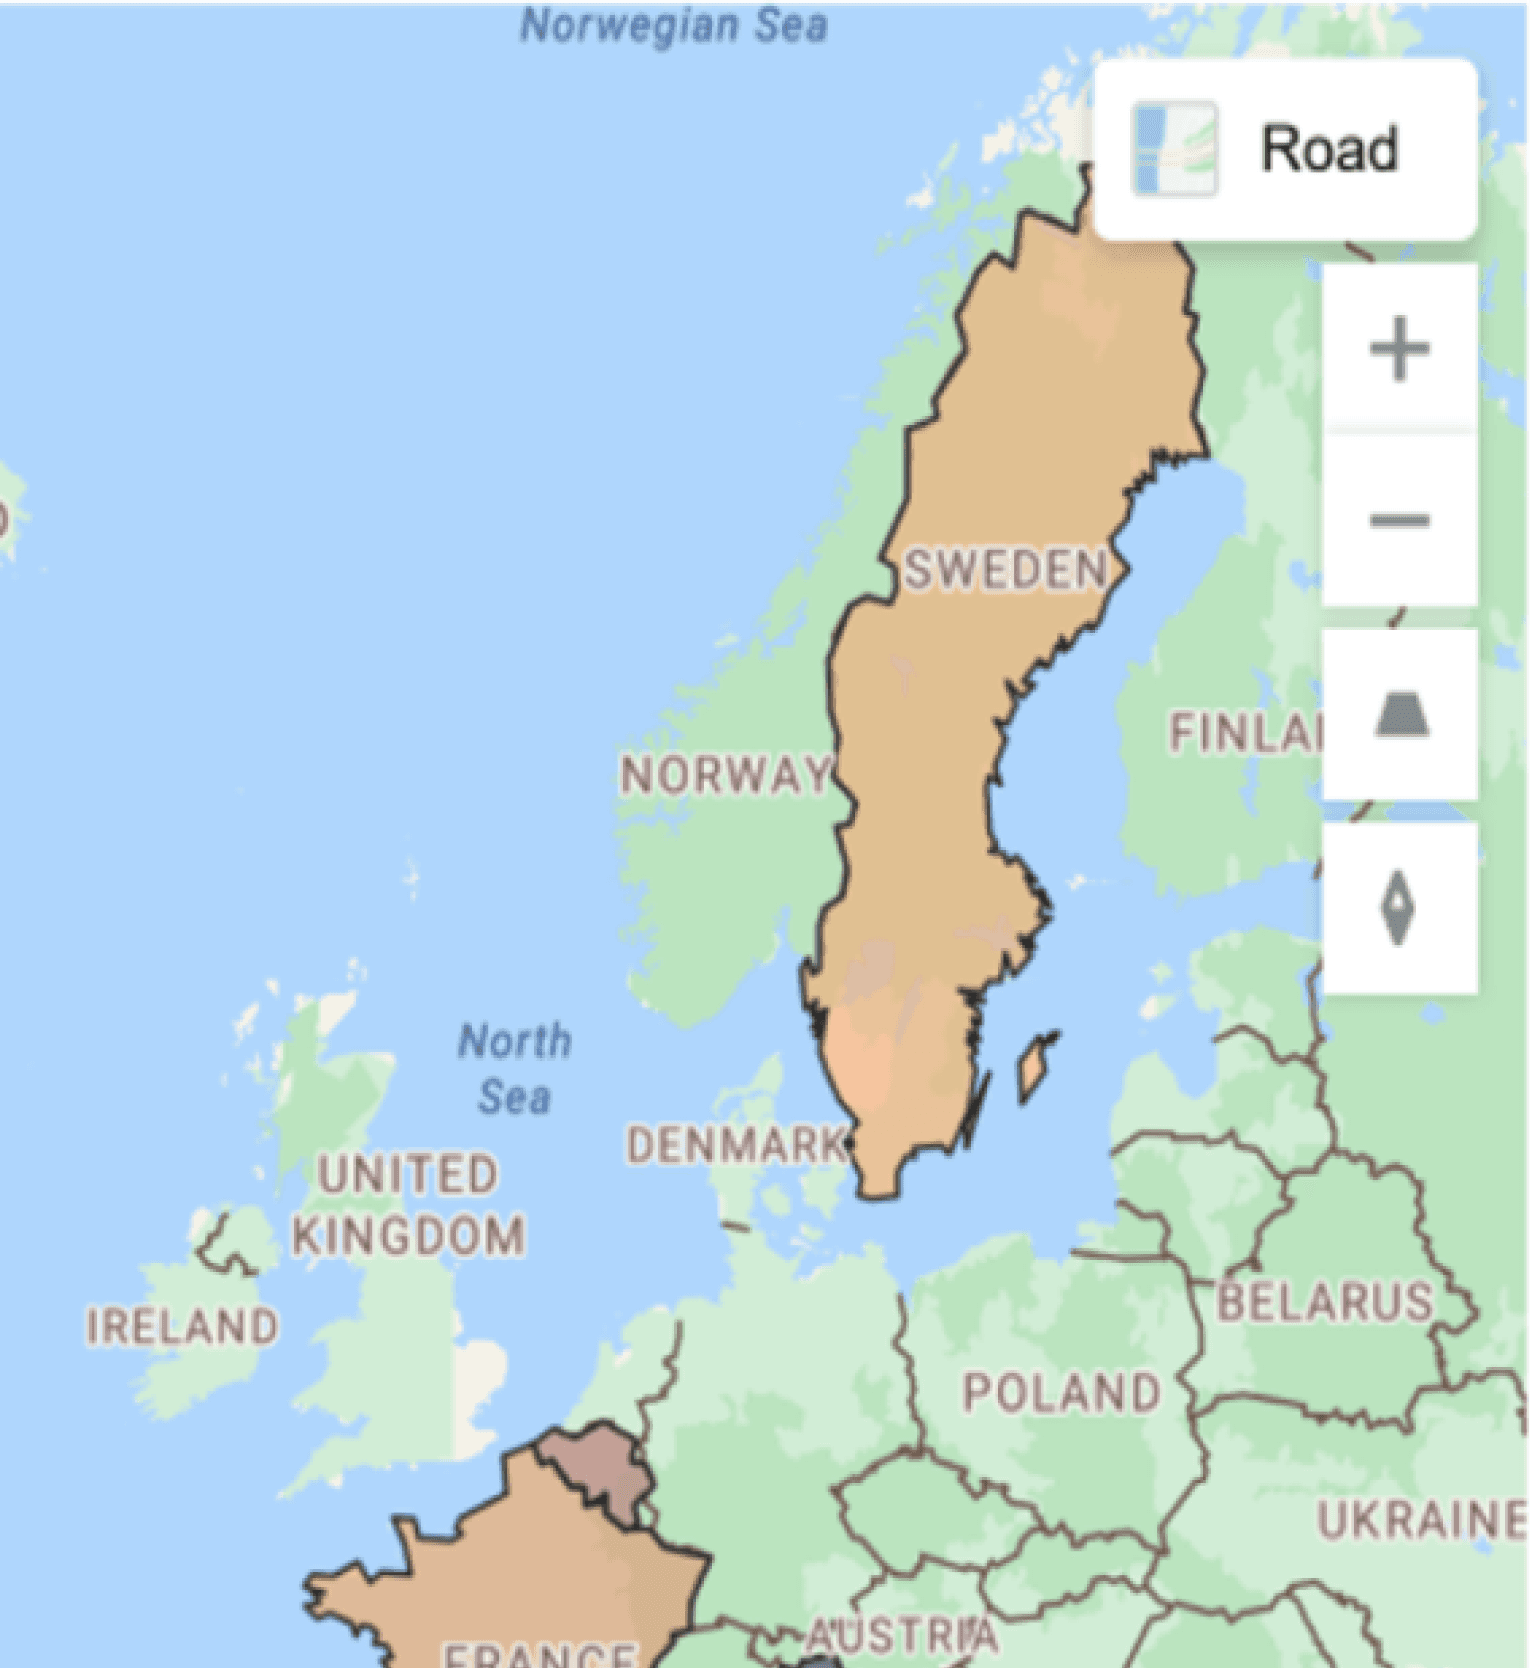
The Location Vitality Index turns footfall, retailer, catchment, behavioural and operational data into a single, comparable score for portfolio health across outlet centres, retail and shopping centres. More than a metric, it is a connected framework built to show you not just what your numbers are, but why they are moving and what to do next.
Five connected layers of intelligence

Five connected layers of intelligence

One comparable score across every asset

One comparable score across every asset

Structural risk visible 12–18 months early

Structural risk visible 12–18 months early

Location Vitality Index

15.2

-0.74% vs YoY

Portfolio overview

Mall Vitality Index

15.2

-0.74% vs YoY

Country

Belgium

Italy

Sweden

Malls

Your center

Your center

Your center

Mall visits

Your center

Your center

Your center

Mall visits YoY

+0.4%

+0.1%

-0.3%

Nat Index

-0.6%

+2.3%

-1.0%

Visit contribution

4.8%

37.0%

29.3%

MVI

13.9

12.3

15.0

YoY

+0.40%

+0.11%

-0.25%

Mall visits

vs Last year

0K

200K

400K

600K

Jan

Jul

Sep

Mar

May

Mall visits change by month

+3.0%

+2.0%

+1.0%

0.0%

-1.0%

-2.0%

+1.7%

+0.1%

+1.7%

+2.9%

-1.6%

-3.0%

Jan

Feb

Mar

Apr

May

Location Vidality Index

15.2

-0.74% vs YoY

Portfolio overview

Country

Belgium

Italy

Sweden

Malls

Your center

Your center

Your center

Mall visits

Your center

Your center

Your center

Mall visits YoY

+0.4%

+0.1%

-0.3%

Nat Index

-0.6%

+2.3%

-1.0%

Visit contribution

4.8%

37.0%

29.3%

MVI

13.9

12.3

15.0

YoY

+0.40%

+0.11%

-0.25%

Mall visits

vs Last year

0K

200K

400K

600K

Jan

Jul

Sep

Mar

May

The challenge

You already track footfall and rent. But can you tell which assets are quietly losing relevance?


Volume is the easy part. The more valuable question is whether each asset is converting its context into sustainable performance. Without a comparable framework, structural risk builds quietly while the financial signal arrives too late to act on it.

From volume to quality of performance

Footfall records how many visits occurred, not how well they converted. An asset can hold steady visit numbers while its retailer capture rate declines — visitors arriving, but no longer engaging with tenants. The LVI measures quality of performance, not simply volume.

Comparing unlike assets, fairly

A dense urban outlet is a fundamentally different environment from a larger, lower-density centre with broad regional reach. Comparing them on the same KPIs misleads. The LVI normalises inputs to local context, so a higher score reflects genuine performance quality — not a size advantage.

From four perspectives to one language

Asset managers, leasing teams, marketing and operations each ask different questions and read different data. One static report cannot serve them all. The LVI gives every team a common score and a driver breakdown that connects their metrics to the whole.

Our approach

A single, transparent score, built from five connected layers.

A single, transparent score, built from five connected layers.

The LVI is built for owners and operators ready to move past descriptive reporting toward diagnostic management. It combines portfolio overview, national context, individual asset behaviour, retailer and brand performance, and real-time operations into one coherent framework — read at a glance, diagnosed in depth, and comparable across every asset you hold.

The LVI is built for owners and operators ready to move past descriptive reporting toward diagnostic management. It combines portfolio overview, national context, individual asset behaviour, retailer and brand performance, and real-time operations into one coherent framework — read at a glance, diagnosed in depth, and comparable across every asset you hold.

Daily footfall

10K

vs last week

+7.7%

Capture rate

1.3%

Total passes

70K

Left to right

40K

vs last week

+7.1%

Right to left

28K

vs last week

+6.4%

Passes by time

Passes from left

Passes from right

09:00

10:00

11:00

12:00

13:00

14:00

15:00

Passer by direction

Passes from left

Passes from right

6K

4K

0

Sep

Oct

Nov

Dec

Store capture rate

Date

29 sept

30 sept

1 oct

2 oct

09:00

10:00

11:00

12:00

13:00

14:00

15:00

16:00

17:00

18:00

STAR

STAR

Store footfall

Street footfall

0.6

0.4

0.2

0.0

Sep

Oct

Nov

Dec

Daily footfall

10K

vs last week

+7.7%

Total passes

70K

Left to right

40K

vs last week

+7.1%

Right to left

28K

vs last week

+6.4%

Passes by time

Passes from left

Passes from right

09:00

10:00

11:00

12:00

13:00

14:00

15:00

Passer by direction

Passes from left

Passes from right

6K

4K

0

Sep

Oct

Nov

Dec

Store capture rate

Date

29 sept

30 sept

1 oct

2 oct

09:00

10:00

11:00

12:00

13:00

14:00

15:00

16:00

17:00

18:00

STAR

STAR

Store footfall

Street footfall

0.6

0.4

0.2

0.0

Sep

Oct

Nov

Dec

Insight that drives action

From a score to a structural early read

The LVI doesn't just rank your assets — it explains them. At driver level it surfaces the early signs of demand erosion: catchment penetration slipping across districts, brand affinity compressing in core categories — often twelve to eighteen months before the financial signal arrives, while the range of responses is still broad.


Wendy Hulshof - Hoven

Questions?

By the time you've scrolled here, you might have some questions. Here to help.

Wendy Hulshof - Hoven

Questions?

By the time you've scrolled here, you might have some questions. Here to help.

How portfolios use the LVI

From daily operations to strategic performance management 

PFM's Location Vitality Index supports a wide range of business questions across outlet portfolio and shopping centre environments.


Identifying structural risk early

Capital allocation and investment priorisation

Tenant mix and leasing strategy

Catchment and competitive positioning

Real-time Place management

A shared performance language across teams

Identifying structural risk early

Capital allocation and investment priorisation

Tenant mix and leasing strategy

Catchment and competitive positioning

Real-time Place management

A shared performance language across teams

Get in touch with our team.

Receive a free personalised quote

Learn more about our offerings

Consult with dedicated data experts

Trusted by industry leaders

Our team will get back to you within 3 business days

Get in touch with our team.

Receive a free personalised quote

Learn more about our offerings

Consult with dedicated data experts

Trusted by industry leaders

Our team will get back to you within 3 business days

FAQ

Frequently asked questions about the LVI.

How is the LVI different from our existing footfall reporting?

Can the LVI compare assets of different sizes, formats and markets?

How much historical data do we need to get started?

How much manual configuration does it need to maintain comparability?

Which drivers predict commercial underperformance earliest?

What data do you need to benchmark a multinational outlet portfolio?

How do you decide where to prioritise capex across a retail portfolio?

How do you measure the ROI of a shopping centre marketing campaign?

How is the LVI different from our existing footfall reporting?

Can the LVI compare assets of different sizes, formats and markets?

How much historical data do we need to get started?

How much manual configuration does it need to maintain comparability?

Which drivers predict commercial underperformance earliest?

What data do you need to benchmark a multinational outlet portfolio?

How do you decide where to prioritise capex across a retail portfolio?

How do you measure the ROI of a shopping centre marketing campaign?

The LVI doesn't just rank your assets — it explains them. At driver level it surfaces the early signs of demand erosion: catchment penetration slipping across districts, brand affinity compressing in core categories — often twelve to eighteen months before the financial signal arrives, while the range of responses is still broad.